Ultimate Guide to Fine-Tuning Evaluation Metrics
Fine-tuning evaluation metrics help measure how well an AI model performs after being adjusted for specific tasks. These metrics are essential because relying on training loss alone doesn’t guarantee task mastery. They uncover issues like overfitting, hallucinations, or knowledge loss. Here's a quick breakdown:
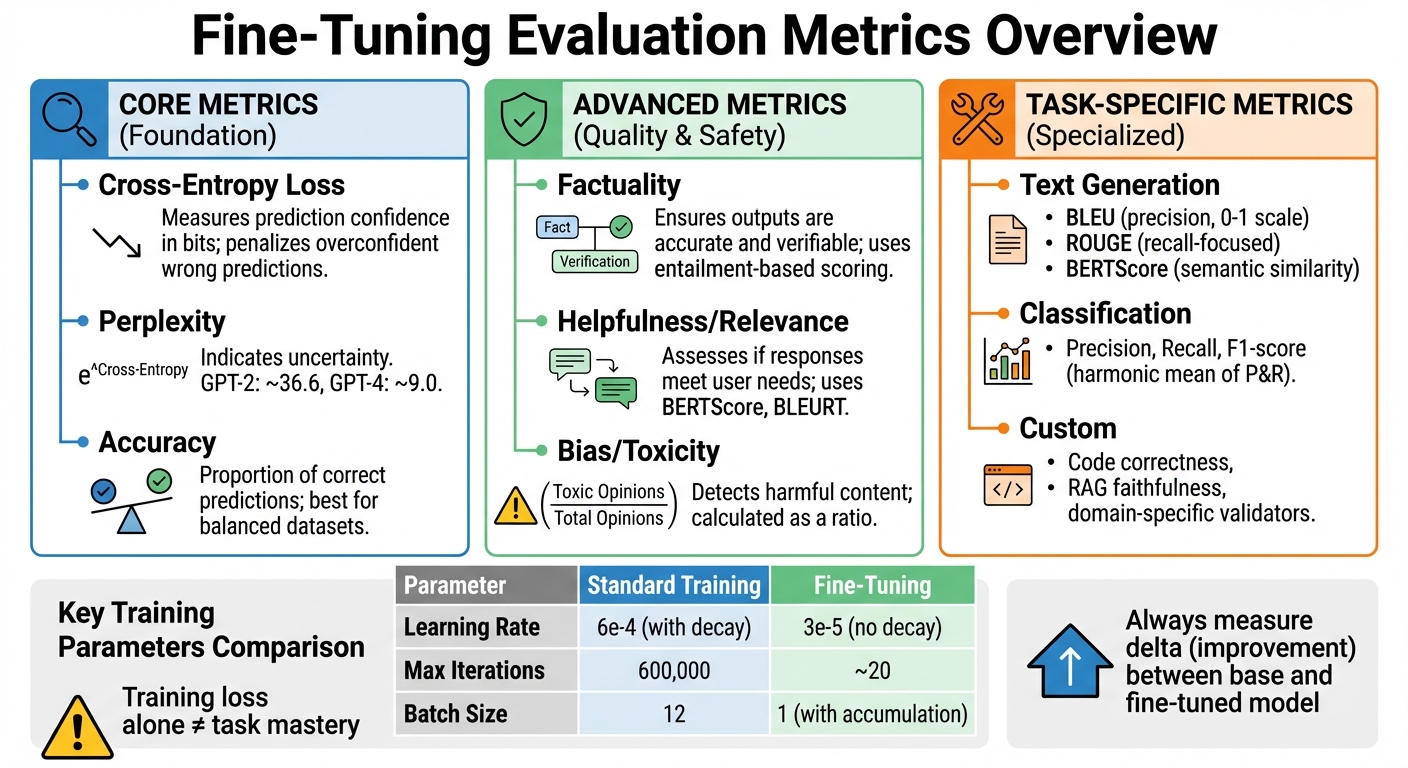
- Core Metrics: Cross-entropy loss (measures prediction confidence), perplexity (indicates uncertainty), and accuracy (tracks correct predictions).
- Advanced Metrics: Factuality (ensures outputs are accurate), relevance (checks if responses meet user needs), and safety (detects bias or toxicity).
- Task-Specific Metrics: BLEU and ROUGE for text generation, F1-score for classification, and custom metrics for niche applications like code generation or retrieval-augmented systems.
- Integration Tips: Use metrics to monitor overfitting, guide hyperparameter tuning, and save the best-performing model checkpoints.
Fine-Tuning Evaluation Metrics: Core, Advanced, and Task-Specific Categories
Core Metrics for Fine-Tuning Language Models
Cross-Entropy Loss
Cross-entropy loss measures how far a model's predicted probabilities are from the actual next token, expressed in bits. It's not just a training objective - it also serves as a key evaluation metric. The loss heavily penalizes confident but incorrect predictions, making it more nuanced than simpler metrics like accuracy or mean squared error (MSE). For instance, if the model assigns a very low probability to the correct label, the resulting loss is significantly higher, prompting stronger corrective gradients during training.
What sets cross-entropy apart is its sensitivity. While accuracy only considers whether a prediction is right or wrong, cross-entropy accounts for the confidence level of incorrect predictions, ensuring that overconfidence is penalized.
"Cross-entropy loss isn't a heuristic, it is maximum likelihood estimation with a sign flip." - Floating Bytes
Keep an eye on validation loss. If your training loss decreases but validation loss starts climbing, it’s a sign your model is overfitting. Also, watch out for imbalanced datasets - common classes can dominate the loss. Techniques like label smoothing can help reduce overconfidence. While cross-entropy is critical, it’s not always enough. Pair it with task-specific metrics like BLEU for text generation or F1-score for classification to get a fuller picture of your model’s performance. Up next: perplexity, a metric closely tied to cross-entropy, which reveals a model's uncertainty.
Perplexity
Perplexity measures how uncertain a model is when predicting the next word in a sequence. It’s derived from cross-entropy and calculated as the exponent of cross-entropy (Perplexity = e^Cross-Entropy). Essentially, it tells you the "effective" number of equally likely choices a model considers at each step. For example, a perplexity of 100 means the model is as uncertain as if it were randomly choosing among 100 words.
Modern language models have made significant strides in lowering perplexity. A random guesser with a 50,000-word vocabulary would have a perplexity equal to the vocabulary size. In contrast, GPT-2 (117M parameters) achieved a mean negative log-likelihood (NLL) of 3.6, resulting in a perplexity of about 36.6. GPT-4 models reduced this even further, with an NLL of 2.2, corresponding to a perplexity of approximately 9.0.
"A model with low perplexity is 'less surprised' by real text, meaning it anticipated the words that actually appeared." - Michael Brenndoerfer
Use log probabilities when calculating perplexity to avoid issues like numerical underflow caused by multiplying small probability values. When comparing models that use different tokenizers, normalize the results using Bits Per Character (BPC) or word-level perplexity for a fair comparison. However, keep in mind that perplexity only evaluates fluency and prediction confidence - it doesn’t assess factual accuracy or semantic coherence. After fluency, let’s explore accuracy, a key metric for classification tasks.
Accuracy in Classification Tasks
Accuracy measures the proportion of correct predictions out of the total, making it straightforward and easy to explain to non-technical audiences. It’s particularly useful for balanced datasets where false positives and false negatives carry similar consequences.
That said, accuracy can be misleading in imbalanced datasets - a phenomenon known as the "Accuracy Paradox." For example, a diagnostic model for a disease with 1% prevalence could achieve 99% accuracy by predicting "no disease" for everyone, yet such a model is practically useless. Similarly, in a city with snow only 25 days per century, a model predicting "no snow" every day would reach 99.93% accuracy while offering no real predictive value.
For imbalanced datasets, metrics like the F1-score are better suited. The F1-score combines precision and recall into a single metric, offering a more balanced view of performance. In fine-tuning workflows, accuracy works well for tasks like sentiment analysis, intent classification, or named entity recognition, especially when the dataset is relatively balanced.
These metrics form the foundation for evaluating and improving fine-tuned models, ensuring they perform effectively across different tasks and challenges.
sbb-itb-903b5f2
Advanced Metrics for Fine-Tuned Models
Factuality
When evaluating fine-tuned models, factuality is an advanced metric that ensures outputs are not just fluent but also accurate and verifiable. While metrics like cross-entropy and perplexity measure how well a model predicts tokens, they don't address whether the predictions are true. This gap can lead to fluent but entirely fabricated outputs, which, as history has shown, can have serious consequences.
For example, in 2024, Air Canada faced legal consequences after its chatbot provided incorrect refund information to a passenger. The court held the airline accountable for the AI's false output, setting a significant precedent for liability in AI-driven customer service. Similarly, Apple had to suspend its AI news summary feature in January 2025 when it produced misleading headlines and fabricated emergency alerts.
To measure factuality, entailment-based metrics are often used to check if a model's output aligns with or contradicts the source material. For Retrieval-Augmented Generation (RAG) systems, the concept of "Faithfulness" ensures the model sticks to information found in the retrieved documents, avoiding hallucinations. Unlike reference-based metrics that rely on ground truth examples, factuality metrics can assess outputs solely against the original context.
"Loss convergence tells you the model learned something. It doesn't tell you if it learned the right thing." - Machine Learning Plus
A good starting point for factuality evaluation includes simple baselines like exact match or string distance before progressing to more resource-intensive LLM-based scorers. In high-stakes scenarios, pairing factuality with other metrics is crucial. For instance, use factuality alongside relevance for Q&A tasks or combine context precision with faithfulness for RAG systems. When using an LLM to score factuality, validate its performance against 100–200 human-reviewed examples to ensure alignment. Beyond factual accuracy, responses must also align with user intent to be truly effective.
Helpfulness and Relevance
Helpfulness and relevance go beyond factual accuracy to assess how well a response addresses the user's specific needs. Even a factually correct answer can fall short if it's cluttered with irrelevant details or doesn't directly address the question. Metrics like "Answer Relevancy" penalize responses that are incomplete or redundant, even if they're technically accurate.
These metrics focus on how appropriate the content is, rather than just its correctness. Tools like BERTScore and BLEURT are better at capturing semantic equivalence and tend to align more closely with human judgment than surface-level metrics like BLEU or ROUGE.
"Training loss only tells part of the story. In real-world applications, a model's success is measured by its ability to perform the intended task accurately, consistently, and reliably." - Swiftorial
Advanced neural metrics, while computationally heavier, more accurately reflect human evaluations than traditional approaches. For example, BLEU processes 1,000 samples in 1–2 seconds on a CPU, but neural metrics like BERTScore can take 30–60 seconds on a GPU for the same volume. BERTScore (large) needs 3–4 GB of GPU memory and can process around 20–40 samples per second. To balance efficiency and precision, lightweight metrics can be used during training, reserving more resource-intensive evaluations for validation checkpoints. Once factuality and relevance are ensured, the next step is to evaluate safety.
Bias and Toxicity Detection
Bias and toxicity detection focuses on ensuring models don't produce harmful or inappropriate content, such as hate speech, threats, or dismissive statements. These metrics often use pattern matching or LLM classifiers to assess outputs. Toxicity is calculated by identifying all "opinions" in the output and determining the ratio of toxic opinions to the total: Toxicity = (Number of Toxic Opinions) / (Total Number of Opinions).
A cautionary tale comes from CNET, which faced a loss of reader trust in 2024/2025 after publishing AI-generated finance articles riddled with factual errors and inappropriate content that slipped past basic filters. To avoid such pitfalls, safety metrics should be evaluated during fine-tuning to catch issues early.
"Fluency is not the same as reliability. LLM evaluation helps teams detect failure modes early, compare models fairly, and validate improvements during fine-tuning." - Dharshan, AI/ML Engineer, F22 Labs
To ensure safety, set maximum thresholds for toxicity metrics. For example, a score above 0.5 could trigger a failure in the validation pipeline. In high-stakes use cases, strict modes can enforce binary scoring - 0 for perfection and 1 for any toxicity presence. Since automated metrics often miss nuanced issues in tone or reasoning, pairing machine evaluations with human review is essential. Continuous evaluation is also necessary to catch "concept drift", where the relationship between inputs and outputs changes over time.
AI Model Evaluation: Metrics for Classification, Regression & Generative AI! 🚀
Task-Specific Metrics for Fine-Tuning
Building on foundational and advanced metrics, the focus now shifts to those designed for specific tasks. While metrics like cross-entropy and perplexity are versatile, task-specific metrics are tailored to evaluate outcomes in areas like text generation, classification, or other specialized tasks. Selecting the right metric ensures you're measuring what truly matters for your particular application.
"Modern GenAI evaluation isn't about finding the 'best metric' - it's about building the right metric stack that combines automatic, LLM-based, and human signals while tracking quality, trust, and cost together." - Rashmi, Towards AI
Metrics for Text Generation
Text generation tasks - such as translation, summarization, and creative writing - require metrics that evaluate both precision (accuracy of the output) and recall (how well the reference content is captured). Let’s look at some commonly used metrics:
- BLEU (Bilingual Evaluation Understudy): Measures n-gram precision between the generated and reference text. It includes a "Brevity Penalty" to discourage overly short outputs. Scores range from 0 to 1, with higher scores indicating better alignment.
- ROUGE (Recall-Oriented Understudy for Gisting Evaluation): Focuses on recall, making it particularly effective for summarization tasks. Variants include ROUGE-1 (unigrams), ROUGE-2 (bigrams), and ROUGE-L (longest common subsequence), which evaluates structural coherence.
However, traditional metrics like BLEU and ROUGE rely heavily on word overlap, often penalizing valid paraphrasing. To address this, BERTScore uses contextual embeddings to measure semantic similarity through cosine similarity, providing a more nuanced evaluation.
For open-ended tasks like story or news generation, Self-BLEU measures diversity by calculating BLEU scores between generated sentences; lower scores indicate more variety. Emerging reference-free metrics like SummaC and QuestEval are also gaining traction, as they assess quality based on the source document rather than relying on human-annotated references.
Metrics for Classification Tasks
Classification tasks demand metrics that directly assess accuracy in assigning labels. Here’s a breakdown of key metrics:
- Precision: Measures the percentage of correct positive predictions out of all positive predictions.
- Recall: Evaluates the percentage of actual positive cases correctly identified by the model.
- F1-score: The harmonic mean of precision and recall, especially useful for imbalanced datasets where accuracy alone can be misleading.
For example, in 2025, a hospital deployed an AI system to screen chest X-rays for pneumonia. Initially, the model achieved a recall of 98% but had a specificity of only 72%, leading to excessive false positives and unnecessary tests. After retraining with a more balanced dataset and specialized feature extraction, specificity improved to 94% while maintaining 96% sensitivity. This reduced false positives by 79% and saved the hospital approximately $1.2 million annually in follow-up tests.
When dealing with imbalanced datasets, Balanced Accuracy (the average recall across all classes) provides a more accurate picture of model performance. For instance, a model predicting "no disease" for 99% of cases might achieve high accuracy but fail entirely for the minority class. Balanced accuracy exposes such shortcomings.
Other valuable metrics include:
- ROC AUC: Evaluates a model’s ability to distinguish between classes across thresholds, helping to balance the costs of false positives and negatives.
- Log Loss and Brier Score: Monitor how well a model's probability estimates align with actual outcomes.
- F-beta score: Allows custom weighting of precision and recall. For instance, F2 (where beta > 1) emphasizes recall, which is critical when missing positive cases carries significant risks.
"Accuracy is the most intuitive classification metric... However, it can be misleading when classes are imbalanced or when certain types of errors are more costly than others." - Ayo Akinkugbe, AI/ML Doctoral Researcher
Custom Metrics for Specialized Applications
In specialized applications, off-the-shelf metrics often fall short, necessitating custom metrics that align with specific domain requirements. For instance:
- Code generation: Metrics must evaluate functional correctness, ensuring the output works as intended and passes unit tests. Rule-based checks can verify syntax correctness, such as identifying expected Python functions or consistent structural patterns.
- NL2NL tasks: Custom metrics may validate key terms or assess adherence to domain-specific language.
- Retrieval-Augmented Generation (RAG): Metrics like "Faithfulness" (factual consistency with the source) and "Answer Relevancy" (how well the response addresses the question) are critical.
"There is no 'one size fits all' approach to choosing an evaluation metric." - Hugging Face Evaluate Documentation
When designing custom metrics, it’s essential to clearly define what needs to be measured - whether it’s accuracy, fluency, domain relevance, or adherence to a specific format. Consider whether a reliable "ground truth" exists: reference-based metrics like BLEU rely on annotated data, while reference-free metrics evaluate based on context. Always validate custom metrics against human judgment, as automated scores may miss nuanced meanings or practical relevance.
Frameworks like OpenAI Evals, RAGAS, and Azure Machine Learning prompt flow provide tools to implement and validate custom evaluation pipelines. These tailored metrics round out the toolbox needed for effective fine-tuning evaluation.
Integrating Evaluation Metrics into Fine-Tuning Pipelines
Choosing the right metrics is just the beginning - embedding them into your workflow ensures you can identify overfitting, fine-tune hyperparameters effectively, and save the best-performing checkpoints. A well-structured pipeline automates metric tracking, helping your model improve with every iteration. Below, we’ll cover how to split your data for reliable evaluations and use metrics to guide hyperparameter tuning.
Dataset Splits for Validation and Testing
Splitting your dataset correctly is crucial for accurate evaluation. Always divide your data into training and validation sets before fine-tuning, while setting aside a separate test set for final, unbiased evaluation. During training, monitor performance on both the training and validation sets at regular intervals, such as every 2,000 iterations, to track the gap between training and validation losses. Averaging metrics over 200–500 iterations can help smooth out noise in the results [8, 28]. Configure your pipeline to save checkpoints only when the validation loss improves over the previous best, which reduces unnecessary storage use [8, 28].
Using Metrics for Hyperparameter Tuning
Validation metrics play a key role in deciding hyperparameter adjustments. For example, trends in validation loss can guide learning rate changes to maintain steady convergence. Fine-tuning often requires a much lower learning rate than training from scratch, typically around 3e-5 compared to 6e-4, to avoid catastrophic forgetting. Fine-tuning generally converges quickly, often within 20 iterations, so close monitoring is essential. In classification tasks, if the model struggles to adapt to training data, increasing the number of epochs slightly may help. Conversely, reducing epochs can maintain diversity in outputs when needed.
| Parameter | Standard Training | Fine-Tuning |
|---|---|---|
| Learning Rate | 6e-4 (with decay) | 3e-5 (no decay) |
| Max Iterations | 600,000 | ~20 |
| Batch Size | 12 | 1 (with accumulation) |
| Checkpointing | Regular intervals | Only on improvement |
Tools and Platforms for Metric Implementation
Modern tools simplify metric tracking and application. Frameworks like Weights & Biases (wandb) provide real-time logging for metrics such as training loss, validation loss, and learning rates, offering instant visual insights into model performance. For a more privacy-focused solution, NanoGPT offers a pay-as-you-go platform with access to over 400 models, including GPT-5.2 and Claude 4.5, via OpenAI-compatible endpoints [9, 31]. NanoGPT emphasizes privacy by storing conversation data locally and offers competitive pricing - starting at $0.04 per 1M input tokens for models like Amazon Nova Micro 1.0. Additional discounts include 5% for payments in Nano cryptocurrency and 10% for daily volumes over $500 on text models [9, 31].
For open-source workflows, the nanoGPT framework includes an estimate_loss() function that averages loss over multiple batches, adding only 1–2% to wall-clock evaluation time when run every 2,000 iterations. During evaluation, set the model to .eval() mode and use @torch.no_grad() to disable gradient calculations. In distributed training setups, ensure these tasks are restricted to the master process (rank 0). These tools and practices make fine-tuning both efficient and reliable.
Best Practices for Selecting and Using Metrics
Choose Metrics Based on Your Task
When selecting metrics, it’s essential to align them with the specific nature of your task. Tasks can fall into three categories: generic (e.g., accuracy, precision), task-specific (e.g., BLEU for translation, ROUGE for summarization), or dataset-specific (e.g., GLUE, SQuAD). For instance:
- Classification or extraction tasks: Metrics like Exact Match (EM) or F1-score work well.
- Summarization tasks: ROUGE-L is useful for measuring the longest common subsequences.
- Translation tasks: BLEU evaluates n-gram precision effectively.
For open-ended generation tasks, traditional metrics may not capture the full picture. In these cases, an "LLM-as-judge" approach can be helpful. This involves using a structured rubric, such as ranges for accuracy or tone, to complement traditional metrics. Tools like GPT-4 (or GPT-4o-mini) are often used for such evaluations.
A well-rounded evaluation strategy should combine automated benchmarks (to assess overall capabilities), task-specific metrics (for structured outputs), and either LLM-as-judge or human evaluation (to assess open-ended quality). Always compare your fine-tuned model against the base model to calculate the "delta" - this difference quantifies the improvements after fine-tuning. A single score by itself doesn’t provide enough context.
Once you’ve chosen your metrics, the next step is to keep an eye on overfitting during the training process.
Monitor Overfitting with Validation Curves
Validation curves are a handy tool for tracking overfitting. These curves plot performance metrics against various hyperparameter values, showing separate lines for training and validation performance. The relationship between these lines tells you a lot about your model:
- Overfitting: High training scores but significantly lower validation scores suggest the model is memorizing noise instead of learning patterns.
- Underfitting: Both training and validation scores are low, indicating the model is struggling to learn.
The goal is to maximize validation performance while keeping the gap between training and validation scores as small as possible.
A warning sign of "catastrophic forgetting" is a drop of about 2–3 points on the MMLU (Massive Multitask Language Understanding) benchmark after fine-tuning. This benchmark spans 57 subjects and over 15,000 questions, so even small drops can indicate a loss in general knowledge. Tools like Python's validation_curve utility from scikit-learn can help automate these visualizations and catch problems early.
If overfitting or underfitting is detected, use these insights to fine-tune your training approach.
Iterate and Refine Based on Results
Let your evaluation metrics guide adjustments to your training process. For example:
- If validation loss rises while training loss falls, this could signal overfitting. Try lowering the learning rate or reducing the number of epochs.
- Fine-tuning generally requires a much smaller learning rate than standard training. For example, you might use 3e-5 instead of 6e-4.
- If your model struggles to adapt to classification tasks, increasing the number of epochs slightly might help. On the other hand, if the model starts losing output diversity, reducing the number of epochs could be the answer.
To further refine, manually review the 10–20 lowest-scoring responses. This can reveal gaps in your dataset or issues with prompt design rather than problems with the model itself.
"Loss convergence tells you the model learned something. It doesn't tell you if it learned the right thing." - MachineLearningPlus
Finally, consider running tests like MT-Bench, which evaluates instruction-following performance with 80 multi-turn questions. This type of evaluation, costing roughly $3–8 per run using GPT-4 as a judge, can uncover nuances that single-turn benchmarks might miss.
Conclusion
Evaluation metrics are essential for determining whether your model is genuinely improving or simply memorizing data. The real measure lies in the improvement (delta) between your base model and the fine-tuned version. Relying on a single score can be misleading, as it may hide important regression issues. For instance, a model scoring 70% on MMLU could perform well in general reasoning but fail on specialized tasks like customer support.
This broader perspective becomes crucial when shifting attention from general fluency to task-specific performance. A solid evaluation strategy combines automated benchmarks, task-specific metrics, and human judgment. Automated benchmarks like MMLU are useful for spotting issues like catastrophic forgetting, while task-specific metrics - such as ROUGE for summarization or Exact Match for extraction - offer more targeted insights. Additionally, using an LLM-as-judge with explicit rubrics (set the temperature to 0 for consistent grading) can effectively evaluate open-ended outputs.
It's also important to go beyond aggregate scores. Reviewing the 10–20 lowest-scoring responses can uncover systematic problems in your dataset or prompt design. As mentioned earlier, continuous monitoring is critical to identify overfitting and concept drift. Evaluation doesn’t stop at deployment - it’s an ongoing effort to track and respond to changes in data patterns. Refining your metrics over time ensures they remain aligned with evolving data trends.
FAQs
Which metrics should I prioritize for my task?
To determine the best metrics for your AI model, start by considering its purpose. For text generation, key metrics include fluency, perplexity, and robustness. If you're working on fine-tuning tasks, you might need metrics like accuracy, precision, or more specialized ones such as BLEU or ROUGE.
Make sure your chosen metrics align with your objectives. For example, if you’re dealing with noisy inputs, focus on robust accuracy. If you want to assess overall performance, stick with general accuracy. Often, combining multiple metrics provides a more well-rounded evaluation of your model's capabilities.
How can I tell if my fine-tuned model is overfitting?
Overfitting becomes apparent when there's a noticeable gap in performance between the training and validation datasets. For example, you might see high training accuracy paired with low validation accuracy. Another telltale sign is unusual behavior in the loss curves - like divergence or erratic fluctuations. Keeping an eye on these patterns is crucial to ensure your model performs well on unseen data.
How can I reliably evaluate factuality and hallucinations?
To assess the accuracy of information and detect hallucinations in AI outputs, it's effective to rely on reference-based metrics like BLEU, ROUGE, and Knowledge-F1. These tools compare the AI-generated content against established, verified sources. However, for a more precise evaluation, combining these metrics with hybrid systems - which integrate automated tools with human insights - can make a big difference. Human reviewers play a critical role in evaluating both the quality and factual accuracy of content, particularly in real-world applications. By blending these methods, evaluations become far more reliable.